NEO Visualization Data Project
Overview
The "NEO Visualization Data Project" aims to visualize and analyze data related to Near-Earth Objects (NEOs). NEOs are celestial objects, such as asteroids and comets, that have orbits that come close to Earth. Understanding NEOs is crucial for planetary defense and scientific research. This project seeks to provide informative visualizations and insights into NEO characteristics, including their orbits, sizes, and close approaches.
Tasks
-
Data Preparation
- You loaded the NEO dataset and parsed date columns to ensure proper datetime handling.
-
Time Series and Scatter Plots:
- Create time series graphs and scatter plots to visualize trends in close approach dates, relative velocities, and miss distances.
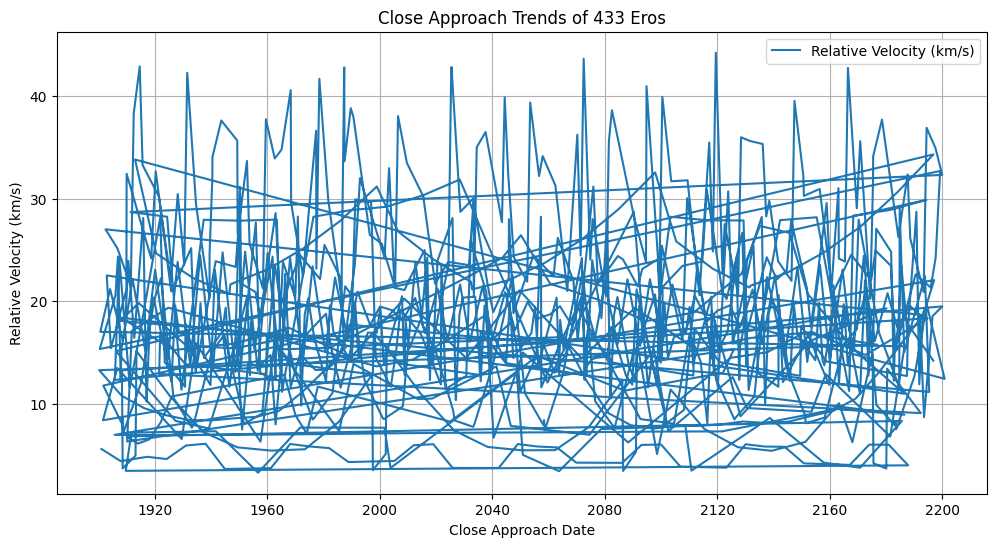
- These plots help in understanding how these parameters change over time.
-
Kernel Density Estimation (KDE) Plots
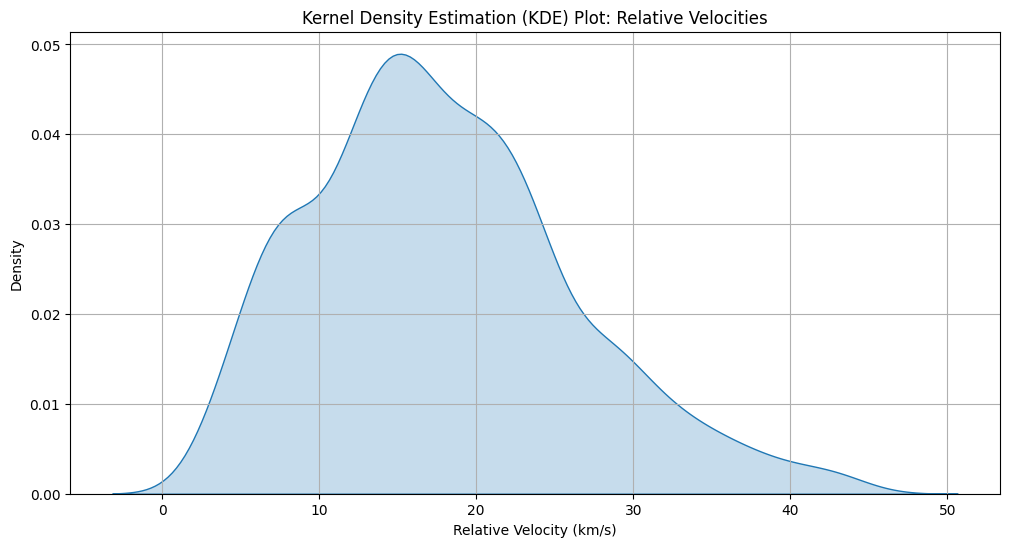
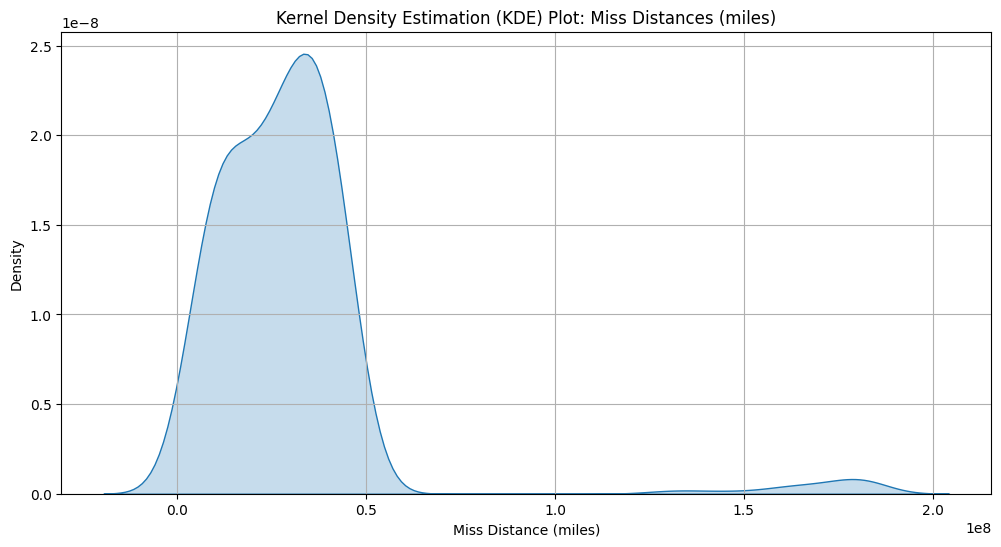
- Generate KDE plots for relative velocities and miss distances to explore their distributions.
- KDE plots provide insights into the probability density of these parameters.
-
Analysis of Relative Velocities:
- Calculate the summary statistics for relative velocities, including mean and standard deviation.
- Identified the average relative velocities in different units (km/s, km/h, miles/h) and their variability.
-
Analysis of Miss Distances
- Similar to relative velocities, you computed summary statistics for miss distances (AU, lunar, km, and miles).
- Highlighted the average miss distances and their variability.
-
More Exploration and Insights:
- Exploring the data by examining object orbits, historical vs. forecast data, and yearly observations.
- Noticed that not all objects have observations for every year.
-
Danger Assessment
- Identified objects that are potentially hazardous based on the dataset.
- Visualized the distribution of hazardous and non-hazardous objects.
-
Correlation Analysis
- Calculated and displayed correlation coefficients between close approach dates, relative velocities, and miss distances.
- Visualized correlations using a heatmap.
-
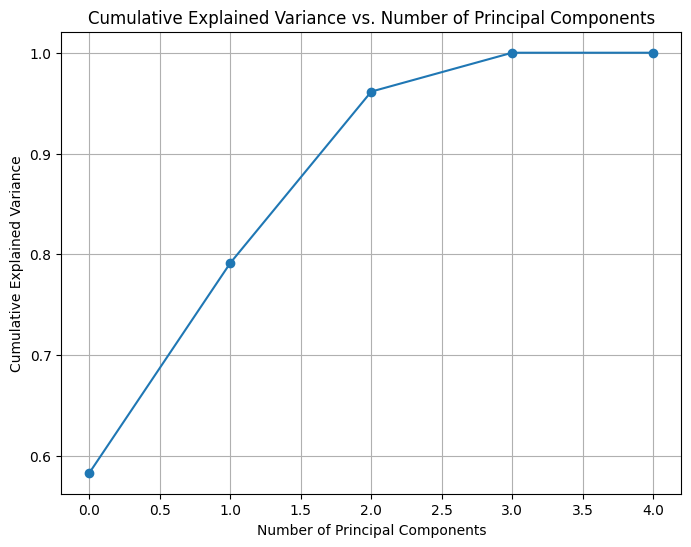
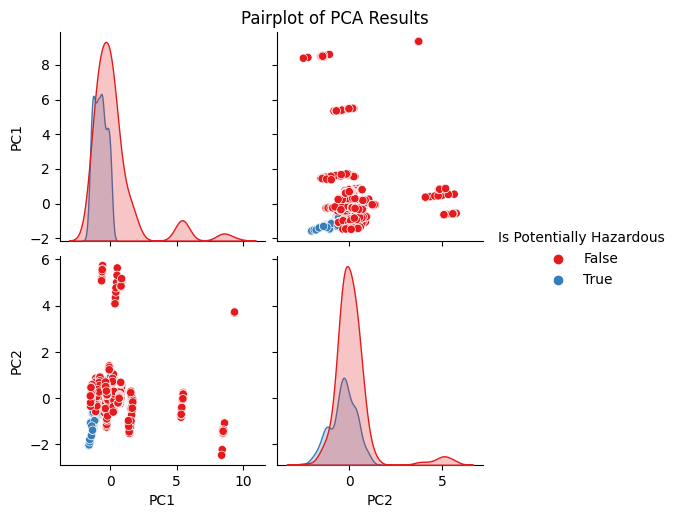
Principal Component Analysis (PCA)
- Performs PCA to reduce the dimensionality of the dataset.
- Visualizes the PCA results with pair plots.
Project Outcome
This project provides a comprehensive analysis of your NEO dataset, helping you gain insights into the characteristics and behavior of Near-Earth Objects during close approaches. It explores various aspects of the data,
including their velocities, miss distances, and potential hazards.
View the code on GoogleColab:
NEO Visualization Data Analysis Project


