Sales Analysis Project
Overview
This project is dedicated to gaining insights into various aspects of sales, including revenue, costs, profits, and key performance indicators (KPIs). By leveraging data analysis and visualization, the project aims to provide a detailed understanding of sales trends, identify growth opportunities, and optimize business strategies.
Tasks
-
Data Import and Overview
- Import essential Python libraries for data manipulation and visualization.
- Load sales data from an external source, such as a CSV file or database.
- Check and handle any missing or inconsistent data to ensure data integrity.
- Examine the structure of the dataset, including data types, column names, and descriptive statistics.
-
Data Exploration and Visualization
- Visualize key sales metrics, such as revenue, costs, and profits, using appropriate charts and graphs.
- Detect and address any duplicate records within the dataset.
- Sort and filter the data to explore sales trends by different criteria, such as time periods or product categories.
-
Key Performance Indicators (KPIs) Analysis
- Calculate and visualize important KPIs, such as gross profit margin, return on investment (ROI), or customer acquisition cost (CAC)
- Develop trend analysis to identify patterns and fluctuations in sales performance over time.
-
Product or Category Analysis
- Analyze sales performance by product or product category, identifying top-selling items
- Visualize product sales trends and seasonality using time series analysis.
- Explore pricing strategies and their impact on sales and profitability.
-
Income Transformation
- Calculate annual income based on the provided logarithmic data and round the values.
- Create an 'annual_income' column to store the calculated annual income values.
-
Customer Analysis
- Segment customers based on purchase behavior, demographics, or location.
- Calculate customer lifetime value (CLV) and customer retention rates.
-
Sales Data Export
- Save the cleaned and enriched sales data to a CSV file or database for future analysis, reporting, or integration with other systems.
-
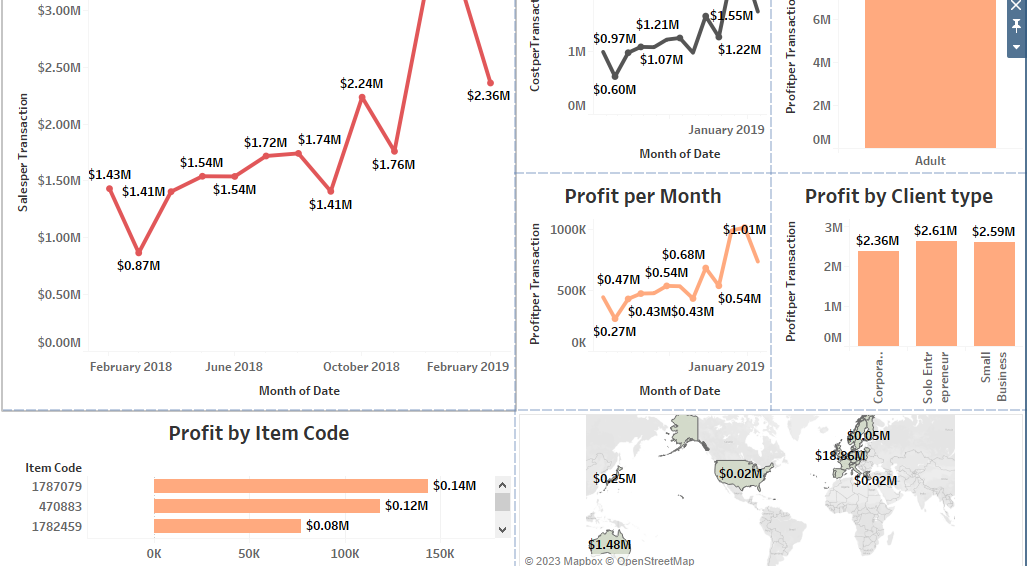
Data Visualization on Tableau
- Export the dataset to create an interactive dashboard on Tableau.

Project Outcome
The Sales Analysis Project aims to provide valuable insights into sales operations and performance. By applying data analysis techniques and effective visualizations, the project enables stakeholders to make data-driven decisions, optimize pricing and marketing strategies, and improve overall sales efficiency. It helps businesses identify strengths and weaknesses, seize growth opportunities, and adapt to changing market conditions.
Note: This project contributes to informed decision-making within the sales and marketing domains, supporting organizations in achieving their sales targets, increasing profitability, and enhancing customer satisfaction. Please note that further analysis, interpretation of findings, and recommendations based on the insights gained from this project may be necessary in a real-world scenario.
View the code on GitHub:
Sales Analysis Project
View the Tableau Visualization on GitHub:
Tableau report file
