Analyzing Titanic Passenger Data
Overview
The sinking of the Titanic is one of the most well-known maritime disasters in history, and the passenger data from that tragic event has provided valuable insights into survival factors.
In this data analyst project, we will dive into the Titanic passenger dataset to analyze and uncover patterns, correlations, and insights that shed light on the factors that influenced passenger survival.
By applying data analysis techniques, statistical methods, and visualization, we aim to provide a comprehensive understanding of the Titanic's passengers and their fates.
Objectives:
-
Data Exploration and Cleaning:
- Conduct a thorough exploration of the Titanic passenger dataset.
- Handle missing data, outliers, and any data inconsistencies.
-
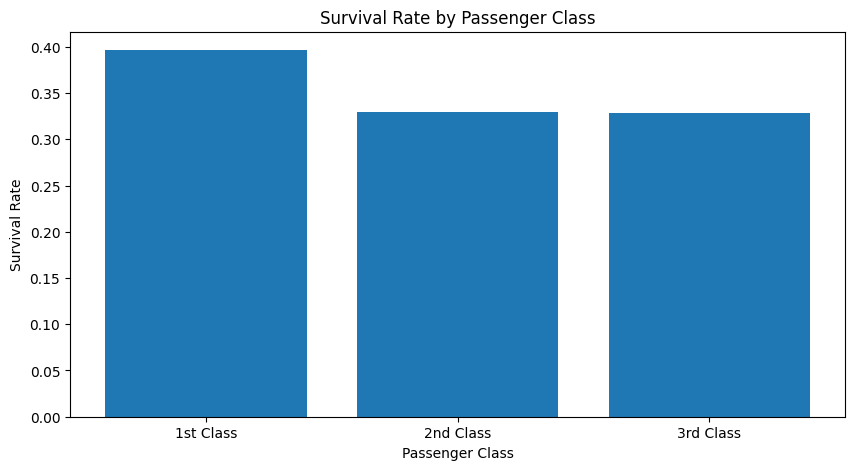
Survival Rate Analysis
- Calculate the overall survival rate of passengers.
- Break down survival rates by different categories such as passenger class, gender, age groups, and embarkation port.
-
Demographic Insights:
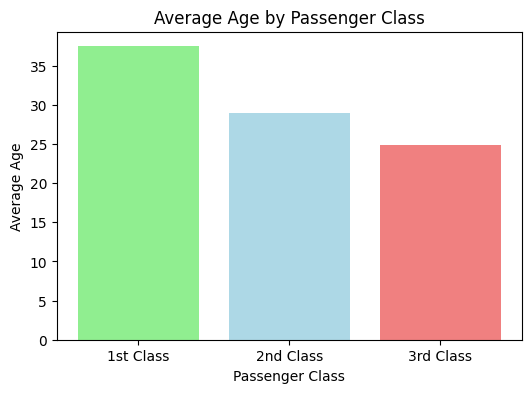
- Analyze the demographic distribution of passengers, including age and gender.
- Determine the average age of passengers and its variation across different groups.
-
Family Relationships:
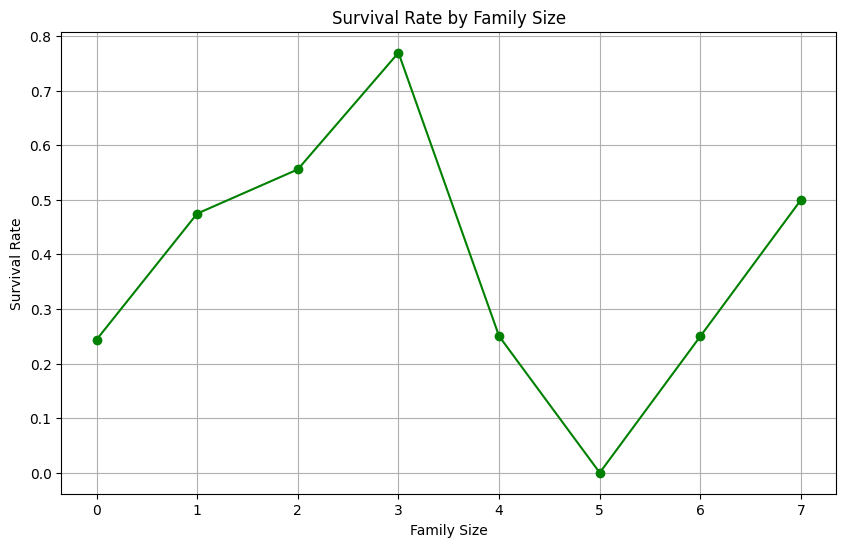
- Investigate family relationships by analyzing the number of siblings/spouses (SibSp) and parents/children (Parch) on board.
- Determine if having family members on board affected survival rates.
-
Fare Analysis
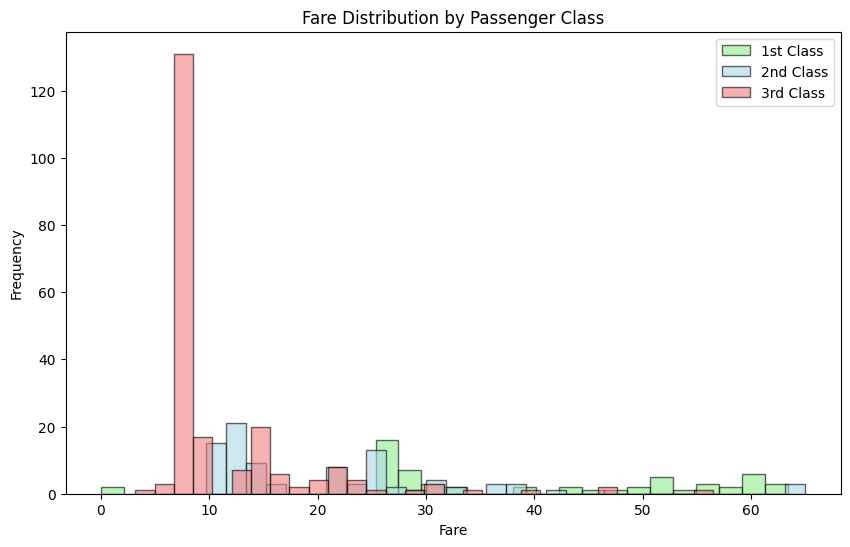
- Examine the distribution of ticket fares.
- Compare fare distributions across passenger classes.
-
Cabin Investigation
- Explore the distribution of passengers across cabins.
- Determine if passengers with cabin information had a different survival rate.
-
Embarkation Port Analysis
- Analyze how embarkation ports (Cherbourg, Southampton, Queenstown) relate to passenger demographics and survival rates.
-
Name Analysis
- Extract titles from passenger names (e.g., Mr., Mrs., Miss) and analyze their distribution.
- Investigate if passengers with specific titles had a different chance of survival.
-
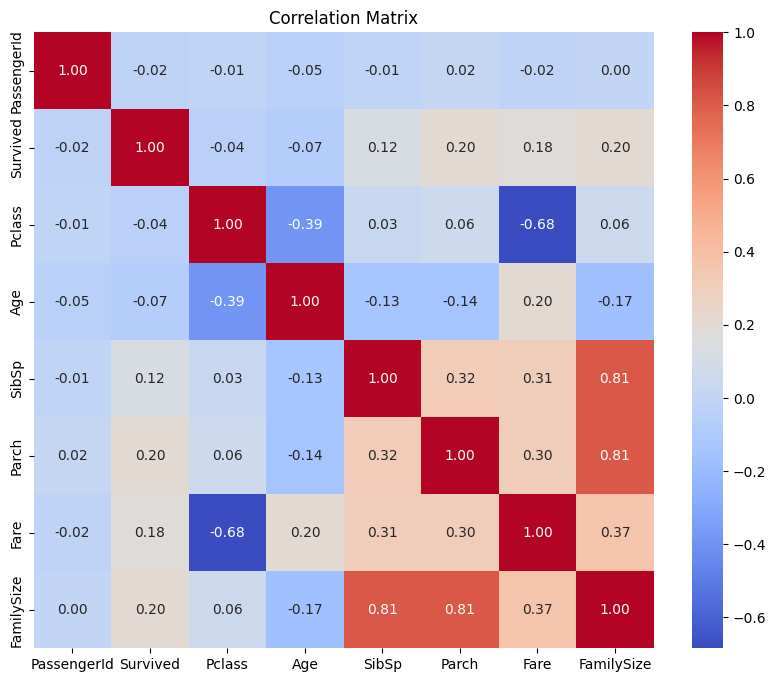
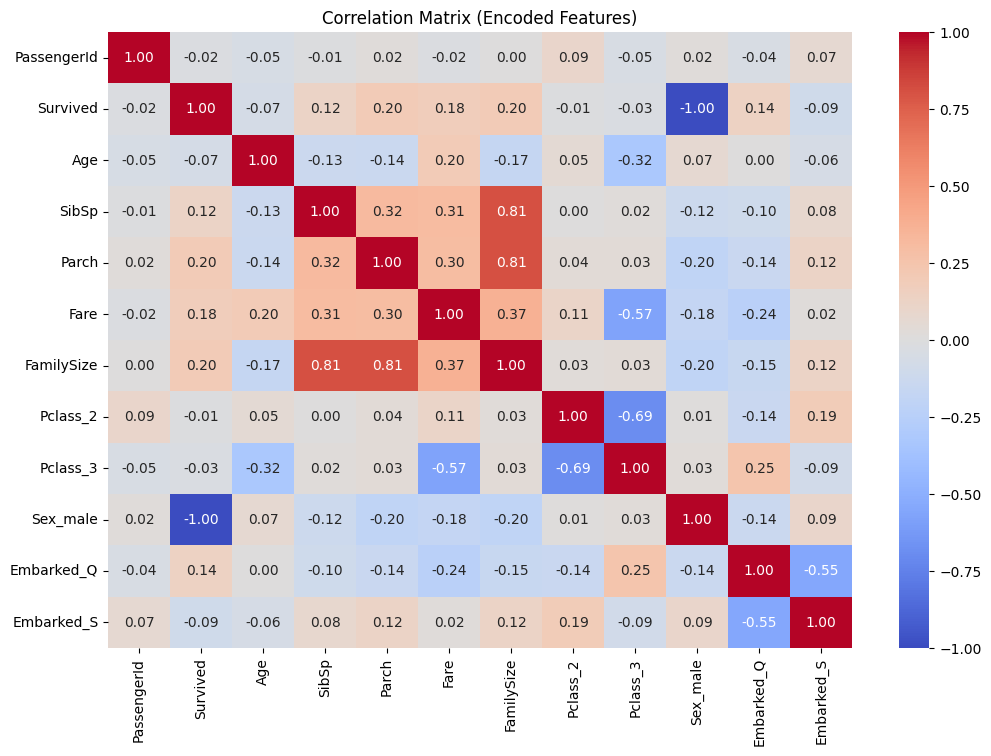
Correlation Analysis
- Calculate correlations between various features to identify relationships.
- Explore how different factors are correlated with each other and with survival.
-
Machine Learning Model
- Build a predictive model to estimate passenger survival based on selected features.
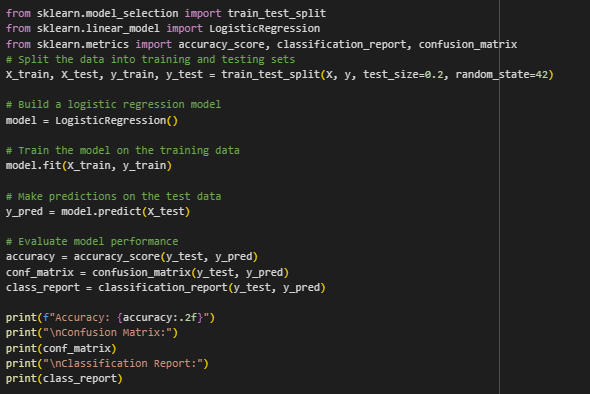
- Evaluate model performance using appropriate metrics.
-
Visualization
- Create meaningful visualizations (e.g., histograms, bar charts, scatter plots) to illustrate key findings and insights.
Project Report
Summarize the project's findings, insights, and any patterns or trends discovered.
Present results in a clear and accessible manner.
See the result


